Smartphone Acoustic Analysis for Home Studio Room Measurement
By Lila Okafor • 25th May
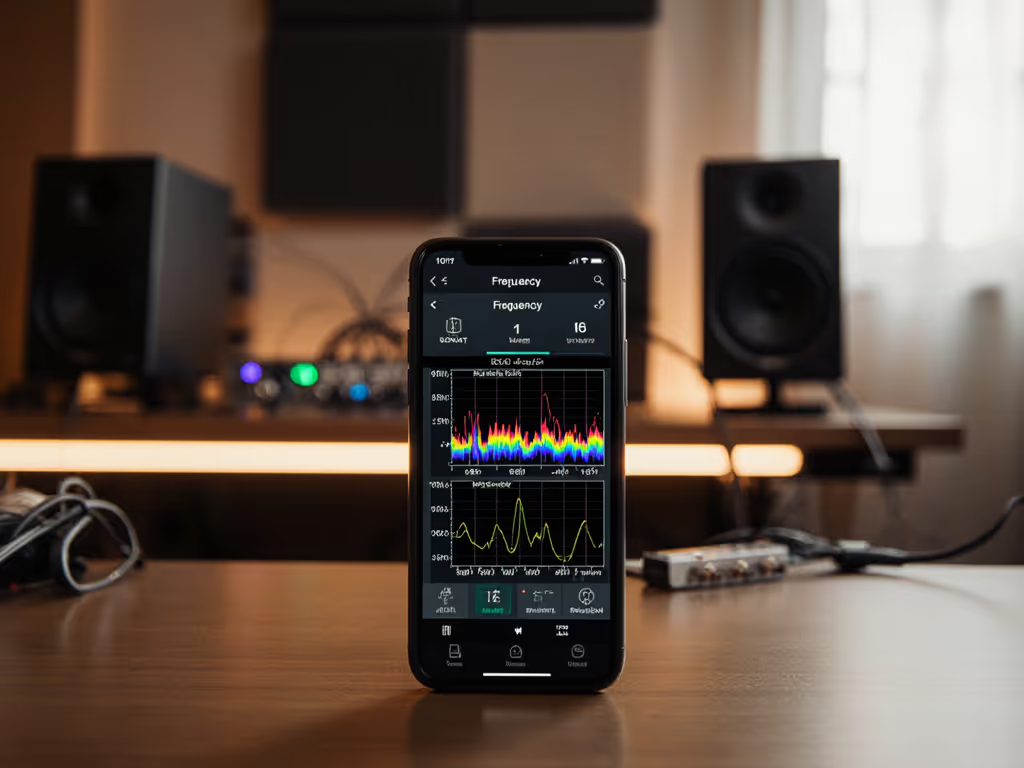
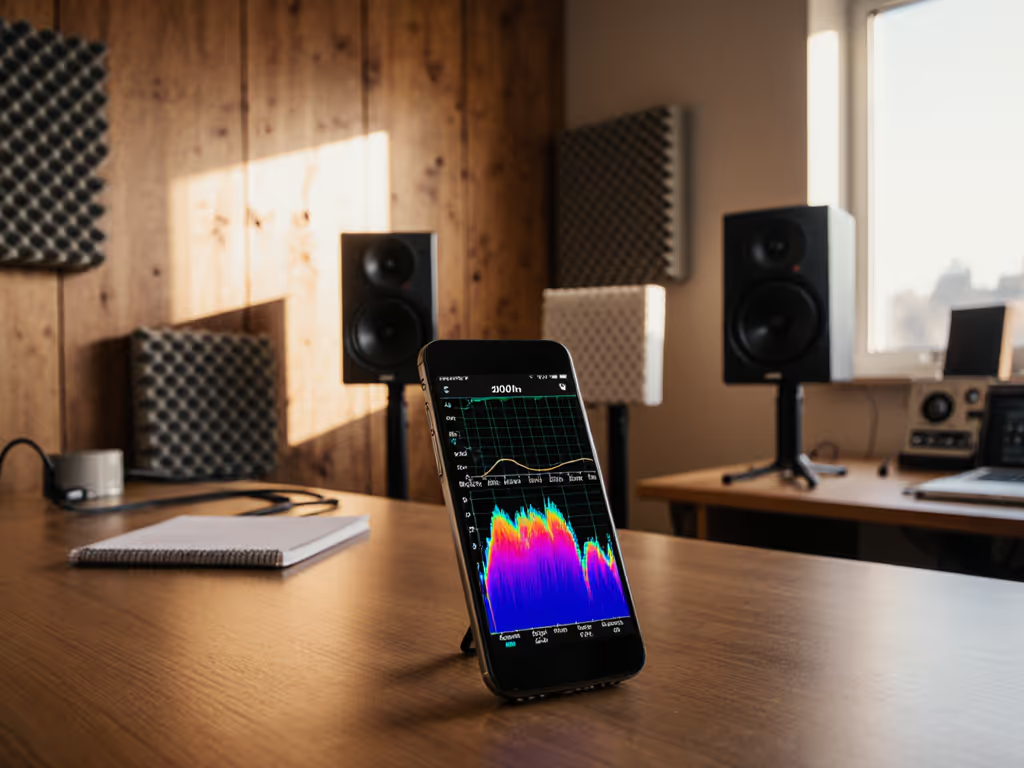
As a mixer who lives in compact rooms and stares at graphs for a living, I use smartphone acoustic analysis as a first-pass flashlight (not a surgical tool). For home studio room measurement, your phone can reveal where the room is lying to you, especially in the lows and low-mids, but only if you understand what it can and can't do.
FAQ 1 - Can a smartphone really measure my room, or is that just hype?
It can, within clear limits.
Research on voice and noise measurement shows that modern smartphones can capture acoustic data good enough for meaningful analysis when used correctly.
- Several studies report that smartphone recordings can be comparable to "gold standard" lab equipment for voice acoustic analysis, as long as the environment and setup are controlled.[1][4][9]
- For sound level work, tests with dedicated SPL apps on iOS found average differences within about ±2 dB of a type 1 sound level meter across 65-95 dB SPL.[5]
Those results are not about studio room measurement specifically, but they tell us two important things:
- The hardware isn't junk. The built-in mics and ADCs are capable of reasonably linear capture over a wide band when the software doesn't get in the way.[1][5][9]
- Technique matters more than brand. Studies find differences between phone models and between apps, and some parameters deviate significantly from lab systems.[5][7][9]
For DIY acoustic analysis in a small mix room, that translates to this rule: your phone is fine for relative decisions (better/worse, more/less), but not for lab-grade absolute numbers.
FAQ 2 - What can I trust my phone to tell me about my room?
Used with good free acoustic measurement apps and careful setup, a smartphone is surprisingly useful for:
-
Overall SPL at the listening position With a calibrated app, you can keep monitoring around safe listening levels of 70-75 dB SPL for long sessions and verify that your "loud check" isn't creeping into unsafe territory.[5]
-
Broad tonal balance & bass lumps Running pink noise or a slow sweep through your monitors, your phone can show 1/3-1/6 octave trends: big humps or holes below ~300 Hz, and obvious brightness or dullness above that.
-
Left/right consistency Measure each speaker separately from the same phone position. Large differences (say >3-4 dB bands) usually indicate asymmetric placement or boundaries.
-
Basic decay time clues (reverb/boom) Some mobile studio measurement tools will estimate RT60 (reverberation time). Even if the numbers aren't perfect, comparisons before vs after adding treatment or moving furniture are very informative.
-
Sub integration sanity checks You can see whether adding a sub creates a giant crossover bump or a hole, and whether moving the sub or changing phase settings helps.
For a bedroom or small office studio, that's enough to solve a lot of "my mixes won't translate" issues before you spend a cent on new monitors.
Curves matter - but only as far as rooms allow.
FAQ 3 - Where do smartphone measurements break down?
Here's where my skeptical side kicks in.
-
Low-frequency accuracy and repeatability Phone mics are not calibrated down to sub-bass, and small differences in placement (a few centimeters) radically change the measured response in the 40-150 Hz region due to room modes and desk/boundary effects. Treat any fine-grained bass curve as "shape, not truth."
-
Device and app variability Meta-analyses comparing smartphones to clinical recording systems report significant differences in some parameters between iPhones, Samsung devices, and reference systems.[7][9] That tells you: your friend's phone results will not match yours, even in the same room.
-
Hidden processing (AGC, noise reduction, EQ) Some OS versions or apps apply automatic gain control and filtering to the mic signal, which corrupts decay and frequency data. This is rarely advertised in the app's description.
-
Fine time-domain work (early reflections, phase) For precise time-of-flight, phase alignment, or detailed waterfall plots, you want a known, calibrated chain (usually a USB measurement mic into a computer). A phone can hint at issues, but not solve them at surgical resolution.
In other words: trust your smartphone for big moves and comparisons, not for deciding whether to add a 0.5 dB shelf at 10 kHz.
FAQ 4 - How do I run a practical DIY acoustic analysis session with my phone?
Here is a repeatable, 45-60 minute workflow tailored to real home studios.
Step 1 - Stabilize your listening position
- Sit where your head actually is when you mix.
- Place the phone exactly at ear height on a stand or stack of books. Don't hold it in your hand; body reflections and movement will skew results.
Step 2 - Choose a sensible app
Look for free acoustic measurement apps that can:
- Display real-time spectrum (1/3-1/6 octave)
- Show dB SPL with switchable weighting (A/C/Z)
- Record or average data over time
Avoid apps that:
- Only show color bars and "smiley faces" for volume
- Hide weighting or don't let you adjust mic calibration
Step 3 - Level and noise control
- Aim for test levels around 70-80 dB SPL at the listening position, loud enough for a clean signal, quiet enough to avoid annoying neighbors.
- Turn off loud HVAC, fans, and anything that hums. For app-by-app setup at quiet working volumes, use our smartphone calibration guide.
Step 4 - Run pink noise and sweeps
- Use your DAW to play mono pink noise through one speaker at a time, then both.
- Watch the spectrum. Note big peaks/dips below ~300 Hz (likely room mode identification and desk/boundary issues) and any broad tilt in the highs. For a step-by-step walkthrough of measuring room modes with your phone, see our smartphone acoustic guide.
Step 5 - Move, remeasure, compare
Change one variable at a time:
- Slide the speakers closer/further from the front wall by 5-10 cm.
- Adjust your chair position forward/back by 5-10 cm.
- Change toe-in slightly.
Repeat the same measurement and take screenshots. The goal is not a perfectly flat line, but the smoothest, least wild low end at your actual mixing posture.
Step 6 - Check decay/boominess
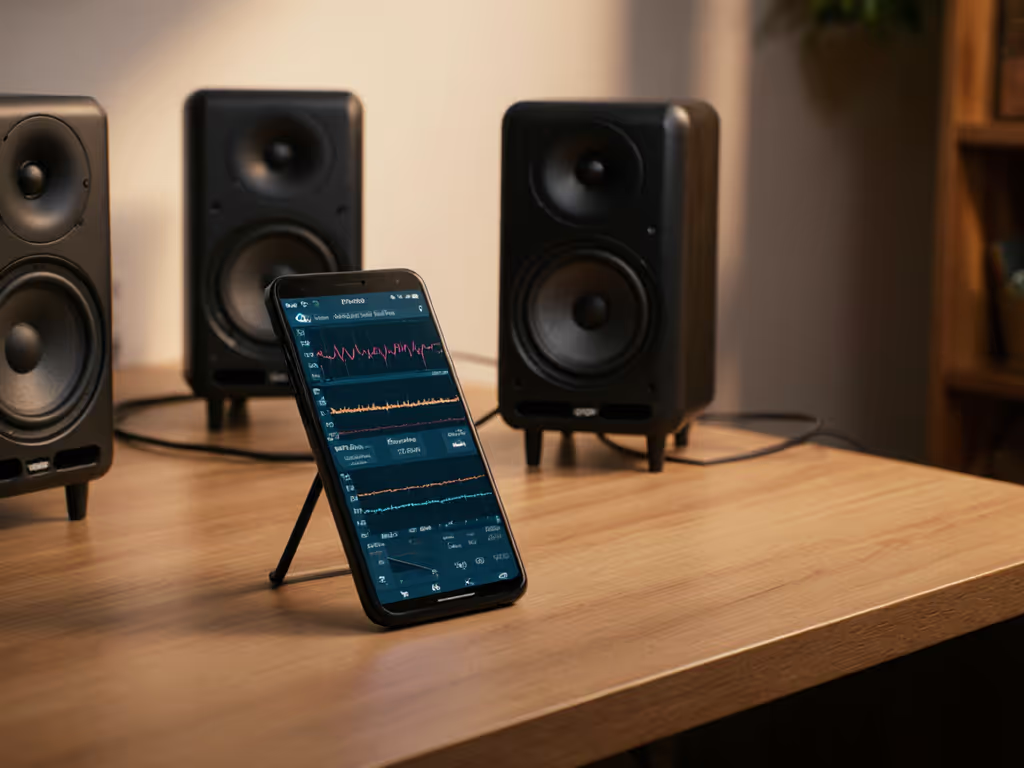
If your app supports it, run an impulse or sweep and look at decay or spectrogram views.
- Long low-frequency tails indicate modal ringing or lack of bass trapping.
- Mid/high flutter is often visible as repeating patterns, move or angle reflective surfaces, or add temporary absorbers.
Even without perfect calibration, before/after comparisons here are powerful. This is exactly how I once uncovered a nasty ~200 Hz bump from a desk surface that made a client think they "liked" hyped presence; moving the desk and adjusting toe-in kept the sparkle but killed the revisions. If desk reflections are causing similar bumps, follow our desk reflection and monitor height guide for fixes that actually translate.
FAQ 5 - Do I need an external measurement mic, or is the built-in mic enough?
If you want to push your home studio room measurement beyond "rough sketch," an external mic is worth considering.
A study comparing smartphone SPL readings to a reference meter found that using external measurement microphones cut both the error and the variance significantly compared with internal mics; the mean difference dropped close to 0 dB, with a much tighter spread.[5] Internal mics showed larger average offsets and more scatter.[5]
Translated: even an inexpensive calibrated omni plugged into your phone can get you closer to "real" numbers than the built-in mic.[5]
I'd frame it like this:
- Built-in mic - Fine for rough bass trends, relative speaker/chair moves, checking overall SPL.
- External calibrated mic - Recommended if you're going to tune a sub, verify room correction, or align multiple listening positions.
But even with a good mic, remember:
Curves matter - but only as far as rooms allow.
FAQ 6 - Can I use my phone data to integrate a sub or trust room correction?
Yes, but with discipline.
Subwoofer integration
Using your phone's spectrum view:
- Measure mains only.
- Measure sub only.
- Measure mains + sub.
You want:
- Similar level around the crossover region between mains and sub.
- No giant hump or deep null where they overlap.
If moving the sub or flipping phase gives you a visibly smoother combined response at the listening position, that's a win, even if the absolute numbers aren't perfect.
Room correction & latency
If you're using desktop software (Sonarworks, etc.) together with mobile checks:
- Use the smartphone to verify trends, not to second-guess every filter.
- Make sure you're not double-correcting (e.g., monitor DSP + DAW plugin doing similar jobs).
- Be mindful of latency - some correction solutions add enough delay to affect tracking comfort. For measured latency and accuracy differences, see our integrated DSP vs Sonarworks comparison.
In my own work, Predictable off-axis wins; latency is the trade-off I watch most closely: I'll accept a modestly imperfect target curve if it keeps timing tight and off-axis/power response behavior stable at the desk.
FAQ 7 - How do I read these curves without overthinking them?
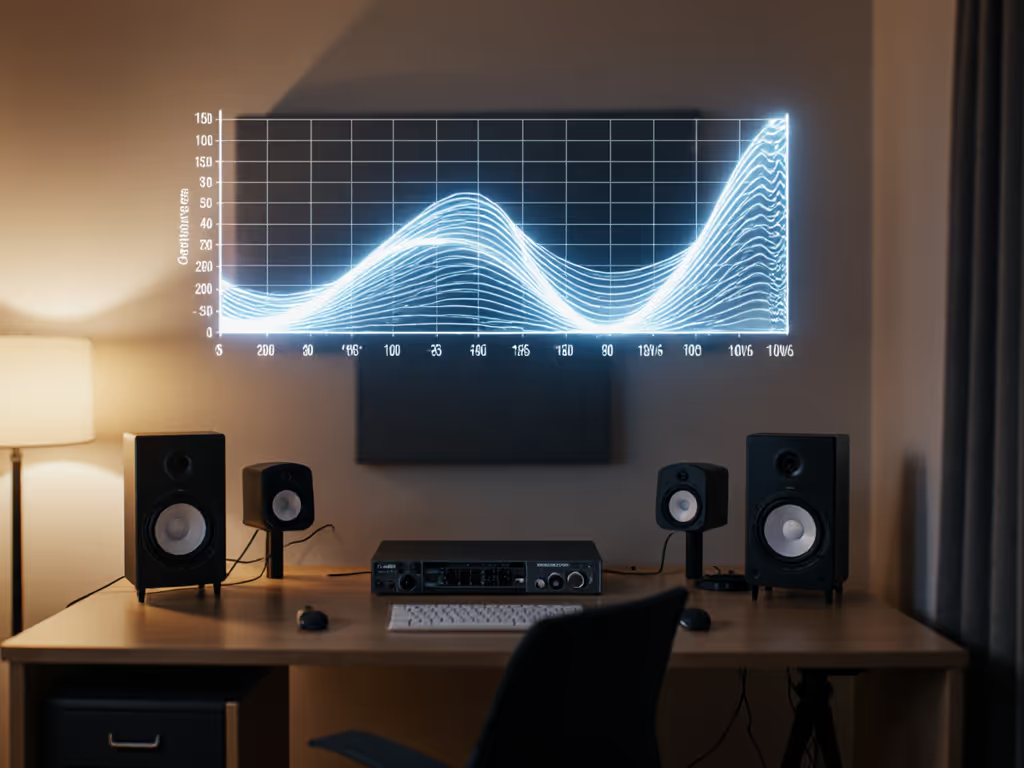
A few graph-reading tips that match small-room reality:
-
Below ~300 Hz - Focus on big swings.
- Peaks/dips larger than about ±6-8 dB over narrow bands are usually room modes or speaker-boundary issues.
- Your goal is to reduce extremes, not flatten everything.
-
300 Hz-5 kHz - Prioritize smoothness and symmetry.
- Left and right should look broadly similar.
- Small wiggles are less important than obvious tilts (e.g., midrange void, honky 1-2 kHz bump).
-
Above 5 kHz - Treat most small variations as "informative but not decisive." That region is heavily influenced by tweeter directivity, placement, and tiny position changes of your head.
-
Time/decay plots - Use them to catch problems, not to chase textbook numbers. Very long decay at a narrow low-frequency band means "this note booms"; flutter in the mids/highs means "clap echo you can actually hear."
Remember: we mix with ears, not spectrograms. The curves help your ears know what to blame. When your listening position is flanked by a desk, screens, and walls under 2 m away, Predictable off-axis wins; latency concerns sit right next to what you see in the graphs.
Where to go from here
If you treat smartphone acoustic analysis as a flashlight rather than a lie detector, it becomes a powerful ally:
- Map your room's low-end behavior.
- Optimize speaker and listener placement with data, not guesswork.
- Validate that changes (treatment, furniture, sub moves) help rather than hurt.
From there, you can decide whether to step up to a dedicated measurement mic and desktop software, or stay in the phone-first world for quick, repeatable spot-checks.
Either way, the goal is the same: fewer surprises when your mix hits earbuds, cars, and TVs, and a monitoring setup you can trust at sane levels in a small, imperfect room.
Related Articles